
Contents
Ramkrishna Forgings (NSE: RKFORGE) ended the week of 7 August 2026 with a notable change in its weekly chart. The share closed above the Ichimoku cloud after spending much of the preceding period below it, and the move came with substantially higher-than-usual volume.
This article explains what the chart shows, why chart readers pay attention to this combination and what would weaken the observation. It does not evaluate the company's valuation or provide a recommendation to buy, hold or sell the stock.
Ramkrishna Forgings chart at a glance
Ramkrishna Forgings manufactures forged, machined and fabricated components for automotive and other industrial applications. Readers can refer to the company's official website and the NSE quote page for current company and market information.
The chart below is a weekly view using the Ichimoku system. The green and red shaded areas form the cloud, the blue and red lines are the faster and slower trend references, and the bars at the bottom show weekly traded volume.
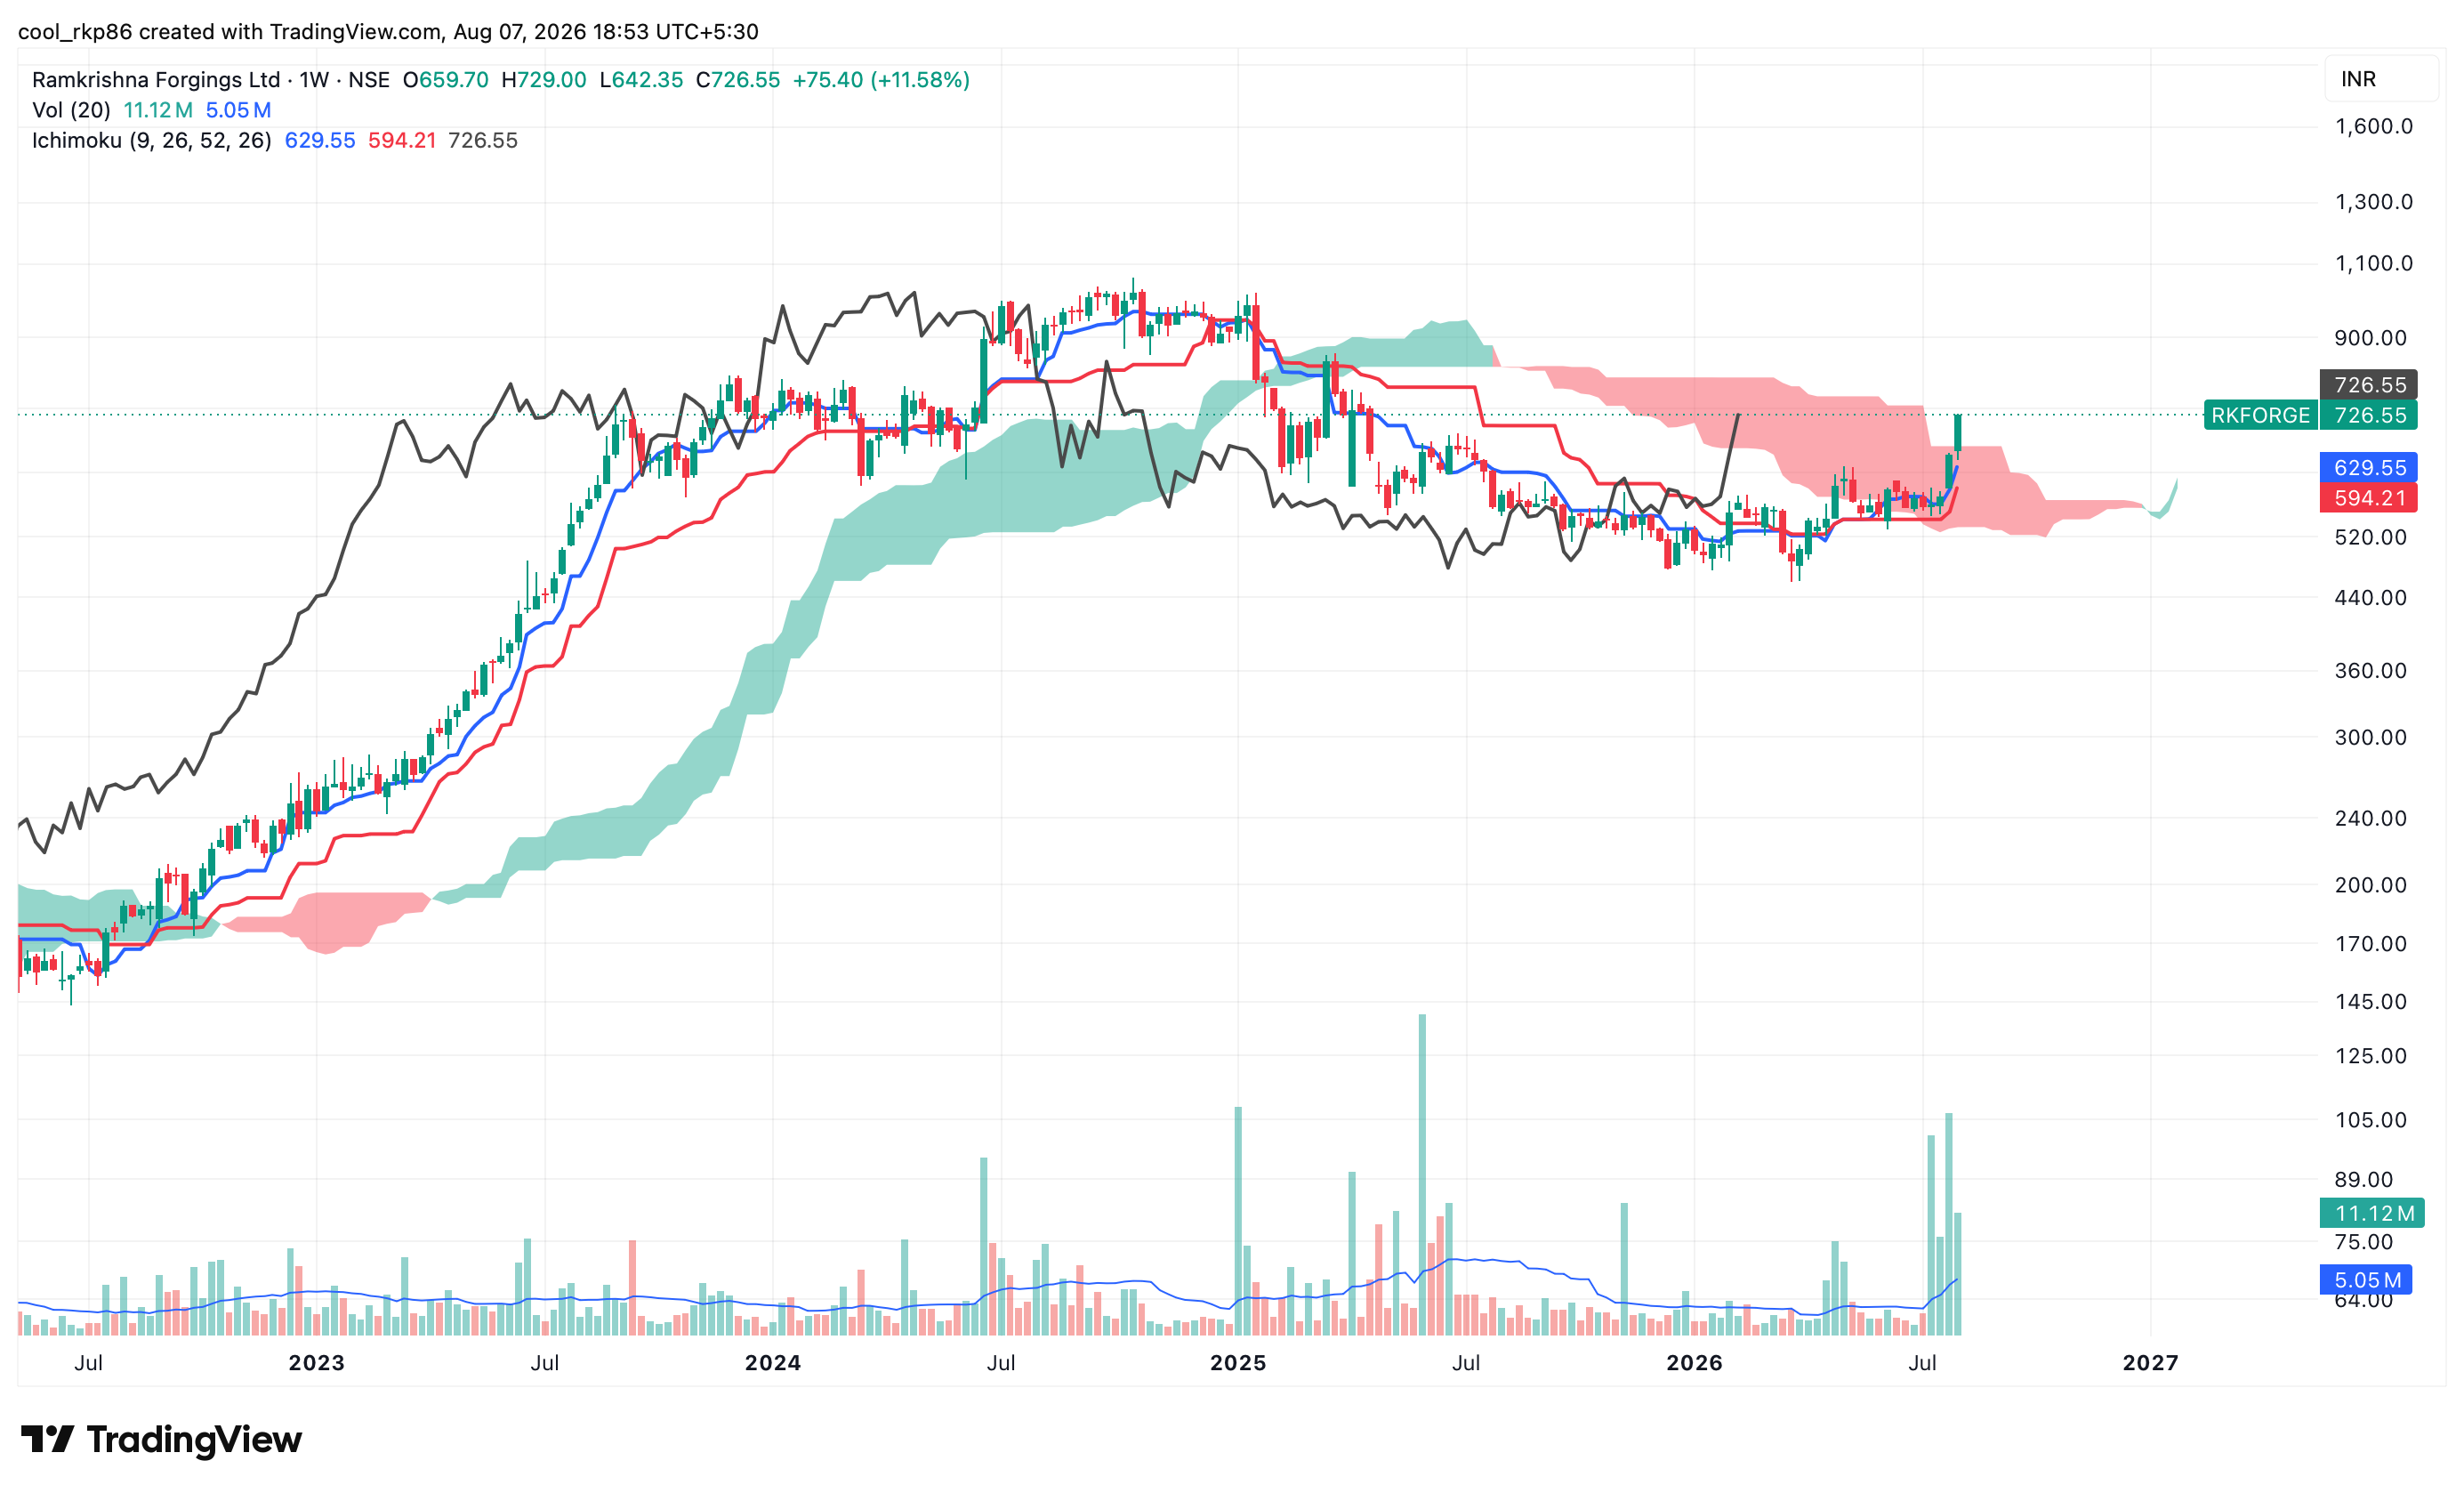
Ramkrishna Forgings Ltd., weekly chart on NSE with Ichimoku cloud and volume. Chart captured on 7 August 2026. Source: TradingView; chart supplied by Genvest.
The week in numbers
| Chart observation | Value |
|---|---|
| Weekly open | INR 660 |
| Weekly high | INR 729 |
| Weekly low | INR 642 |
| Weekly close | INR 727 |
| Weekly change | +11.58% |
| Weekly volume | 11.12 million shares |
| 20-week average volume | 5.05 million shares |
| Faster Ichimoku line | INR 630 |
| Slower Ichimoku line | INR 594 |
The stock closed close to the week's high, while volume was about 2.2 times its 20-week average. This combination is why the week stands out on the chart.
What the weekly chart shows
Price moved above the cloud
The shaded Ichimoku cloud represents a zone built from prior price information. When price is below it, chart readers often treat the cloud as an area of resistance. A weekly close above it suggests that the recent price structure has improved.
For RKFORGE, the move is notable because the stock had spent much of the period after its 2024 peak below or around the cloud. The latest close moved beyond that zone in one strong weekly candle.
This is evidence of a change in the chart, not proof that the price must continue rising.
Volume expanded with the move
About 11.12 million shares traded during the week, compared with a 20-week average of 5.05 million. In other words, volume was roughly 2.2 times the recent weekly average.
Higher volume indicates that broader participation accompanied the price move. Chart readers generally give more weight to a breakout supported by higher volume than to one occurring on quiet trading. Volume, however, cannot predict what happens next.
The faster line remains above the slower line
The faster Ichimoku reference stood at approximately INR 630 and the slower reference at approximately INR 594. The faster line was above the slower one, while the weekly close was above both.
That is the alignment usually associated with an improving trend. These lines are derived from past prices, so they confirm what has happened rather than forecast future returns.
Historical chart zones worth monitoring
The following areas are reference zones visible on this chart. They are not price targets, guaranteed support levels or instructions to trade.
| Chart area | Why chart readers may monitor it |
|---|---|
| INR 630-660 | The recent cloud and breakout region. A future retest could show whether the move is holding. |
| Around INR 594 | The slower Ichimoku line, which provides a deeper trend reference on this chart. |
| INR 840-1,000 | A broad historical area where earlier declines began and prior supply may remain. |
The location and meaning of these zones will change as new weekly prices are added to the chart.
What would weaken the observation?
- A weekly close back inside or below the Ichimoku cloud
- Higher volume without subsequent weekly closes holding above the breakout region
- The faster Ichimoku line turning below the slower line
- A sharp rejection as price approaches an area of prior supply
None of these conditions should be used alone. They are simply ways to test whether the chart continues to support the original observation.
How to use this chart correctly
Technical analysis can help describe trend, participation and market behaviour. It does not answer whether a company is fairly valued, whether its earnings can grow or whether the stock suits a particular investor.
Before acting on any single-stock idea, consider:
- The company's business, balance sheet, earnings and valuation
- Position size and concentration in your existing portfolio
- Your investment horizon and ability to tolerate a sharp decline
- Whether new information has changed the original investment case
- Transaction costs and tax consequences
A single indicator should be one input in a broader decision process, not the decision itself.
In one line
RKFORGE's weekly close above the Ichimoku cloud, supported by roughly 2.2 times average volume, is a notable change in chart structure that still needs follow-through.
Important disclosure
This article is an educational explanation of a publicly displayed market chart. It is not a research report, personalised investment advice or a recommendation to buy, hold or sell Ramkrishna Forgings or any other security. The chart and figures reflect information visible on 7 August 2026 and may become outdated.
Historical chart zones are not price targets, forecasts or guarantees. Technical indicators can produce false signals, and a security can move sharply because of company-specific, market or liquidity risks. Readers should assess current public disclosures, business fundamentals, valuation and their own circumstances before making an investment decision.
Genvest is a brand of Coinwise Research Private Limited, a SEBI-registered Investment Adviser (INA000018382). Registration granted by SEBI, membership of BASL and certification from NISM do not guarantee performance or provide any assurance of returns. Investments in securities markets are subject to market risks. Read all related documents carefully before investing.